Finance & Operations
Effective CEOs and CFOs Know When Financial Reports Are Not Enough
How well are you using your P&L and other financial reports?
You probably said, “Very well.” You are probably right, to a point.
Financial reports are great for understanding profitability, working capital, and overall business performance.
They are overused when searching for cost saving opportunities because they point to where a problem exists, but they rarely explain why it exists or how to fix it.
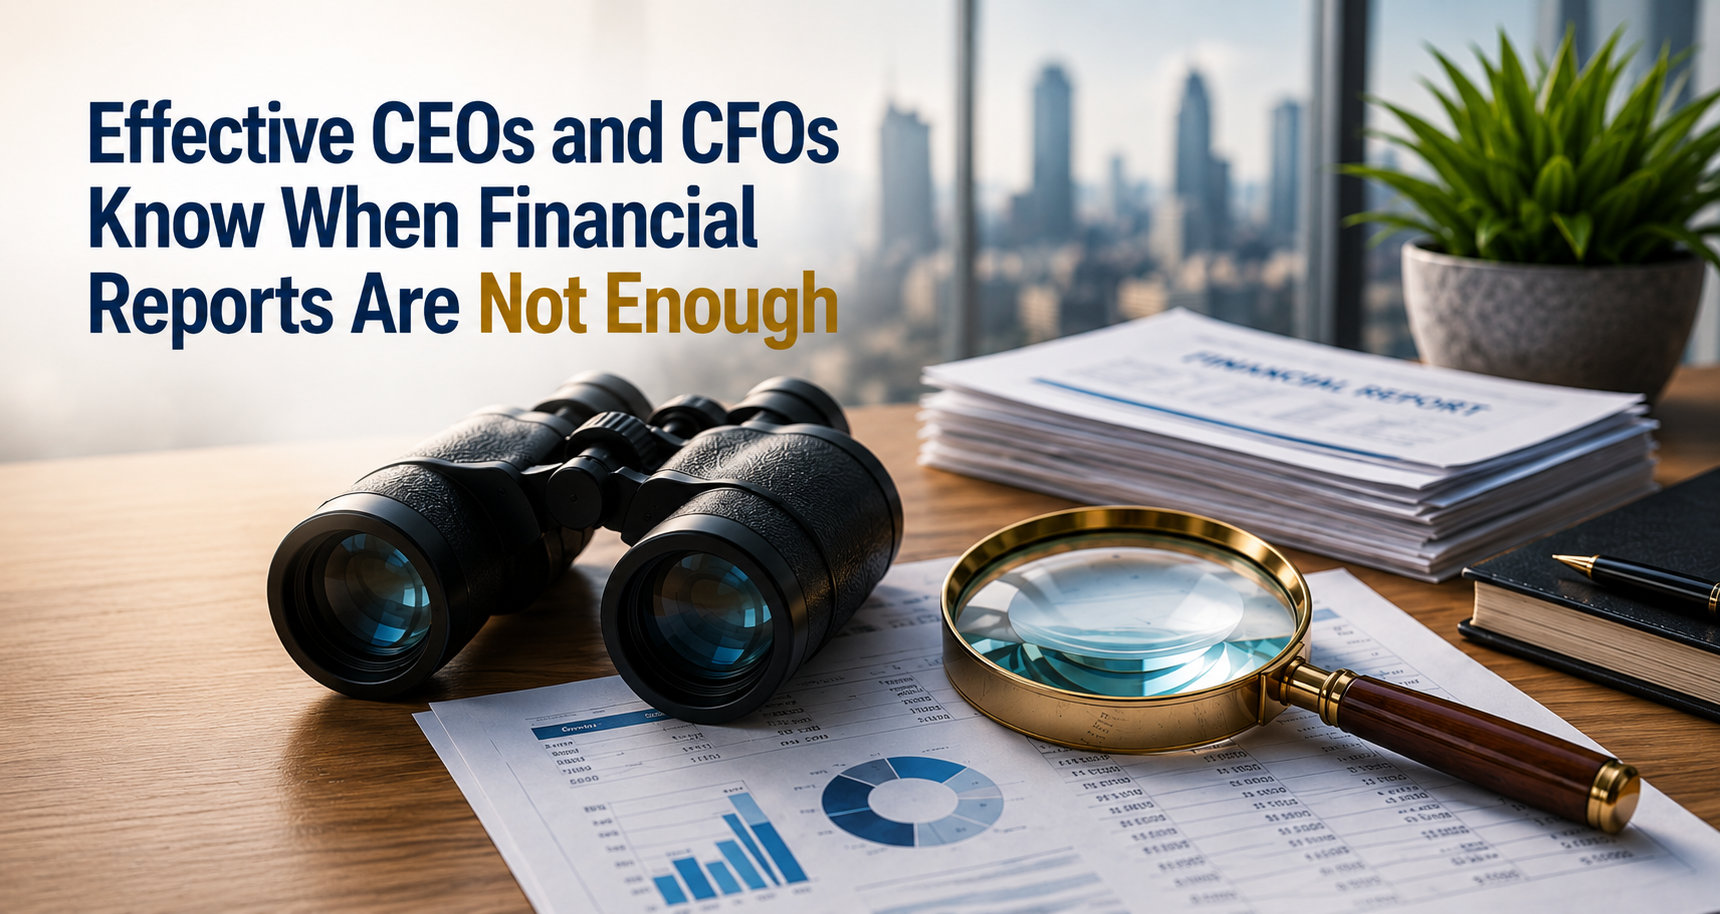
Financial reports show the big picture, and predict what is on the horizon. They are like binoculars in that regard.
Finding cost savings hidden just below the surface requires a magnifying glass, not binoculars. That is where spend analytics comes in.
Spend analytics is the magnifying glass that reveals cost savings opportunities, often 2% of revenue or more! Start by looking for these types of things (but there is a lot more to find):
- Different locations paying different prices for the same item
- Purchases occurring outside negotiated agreements
- Significant spending taking place without purchase order discipline
- Hundreds of suppliers accounting for only a small percentage of spend
P&Ls don’t show this stuff. Neither do balance sheets.
That is why capturing meaningful savings from sourcing starts with a strong spend analytics exercise. Don’t just order your people to: “Negotiate harder”, “Cut off a bunch of suppliers” or “Cut the budgets and see what happens”.
Build the fact base that explains why your business is performing the way it is. You will reveal savings that can drop 2+% of revenue to the bottom line. That is a major improvement to results and will change what you see on the horizon.